Marketing Strategies
May 8, 2025
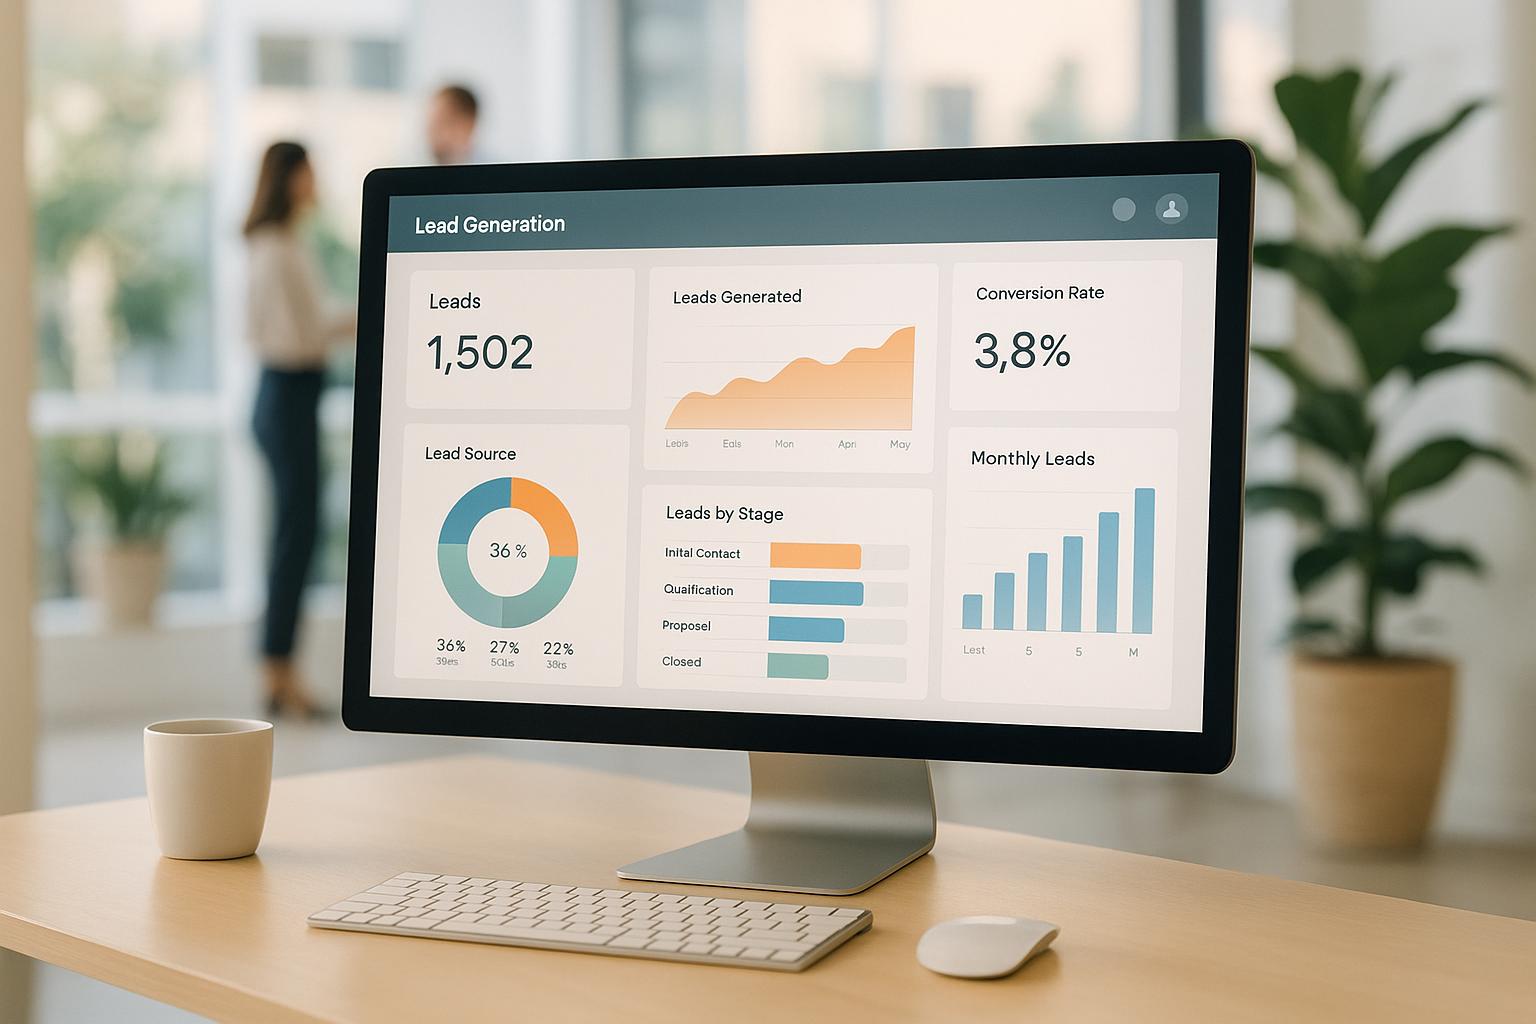
Unlock lead generation success with these 10 dashboard design tips that enhance tracking, boost conversions, and reduce costs.
Want to boost lead generation with actionable dashboards? Here’s the deal: A well-designed dashboard can double or triple conversion rates while slashing acquisition costs by up to 45%.
Key Takeaways:
Set Clear Goals: Define lead volume, quality, and cost targets.
Track Quality Metrics: Focus on engagement, intent, and account fit.
Keep Layout Simple: Prioritize key metrics with clean, mobile-friendly designs.
Use Real-Time Data: Update every 6 hours to act on high-intent leads quickly.
Integrate with CRM: Automate data syncing for seamless lead tracking.
Color-Code Priorities: Highlight urgent leads with clear, consistent colors.
Add Filters: Segment leads by behavior, demographics, and intent.
Track Sources: Attribute leads to campaigns with detailed UTM tracking.
Show Conversion Paths: Visualize lead journeys to spot drop-off points.
Quick Comparison Table:
Feature | Benefit | Example Impact |
|---|---|---|
Real-Time Updates | Faster response to leads | 42% lower cost per lead |
Lead Filtering | Focus on high-value opportunities | 71% increase in lead volume |
CRM Integration | Streamlined workflows | 50% reduction in manual errors |
Mobile Optimization | Access insights on the go | 37% faster response times |
By combining intent-driven data with straightforward design, your dashboard can become a powerful tool for lead generation success.
How to Create the Best Marketing Dashboards That ACTUALLY Make Sense
1. Set Clear Lead Goals
To improve lead generation, start by defining specific and measurable goals for your dashboard. Research shows that companies without clear targets spend 23% more time analyzing irrelevant data.
Focus on creating SMART objectives. For example, instead of vague goals, set clear targets like increasing form completions from 8% to 12% by Q3 2025.
Here’s how you can structure your dashboard goals:
Goal Component | Example | Metric |
|---|---|---|
Lead Volume | 300 CRM-qualified leads/month | Daily/weekly lead count |
Lead Quality | 75+ lead score threshold | Lead scoring distribution |
Response Time | 45-minute maximum | Average response delays |
Cost Efficiency | $50 maximum cost per SAL | Channel-specific CPL |
One financial services company cut its cost per lead by 41% by focusing on underperforming channels and tracking lead timing through daily monitoring.
Key Metrics to Track
Make sure your dashboard includes these critical KPIs:
Lead-to-MQL conversion rate (industry average: 13%)
Cost per Sales Accepted Lead (SAL)
Lead source ROI by channel
Real-time lead intent scores
During the COVID pandemic, 24/7 Intent adjusted its lead generation goals weekly, using real-time intent data to adapt to rapidly changing buyer priorities.
Regular Reviews and Adjustments
Review and update your dashboard goals on a monthly or quarterly basis. For example, BMC Software’s focused approach resulted in a 53% increase in marketing-qualified leads and a 22% faster sales cycle within just six months.
You can also assign points for specific actions - like 5 points for a website visit, 15 for downloading a whitepaper, and 25 for viewing your pricing page. When a lead reaches a certain threshold, alert your sales team immediately.
Finally, ensure your dashboard tracks quality metrics to further qualify leads and refine your strategy.
2. Track Key Lead Quality Metrics
To design a useful dashboard, focus on metrics that reveal genuine purchase intent. Studies show that tracking the right lead quality metrics can lead to 2–3x higher conversion rates while cutting customer acquisition costs by 30–45%.
Key Lead Quality Indicators
Metric Category | Key Metrics | Dashboard Implementation |
|---|---|---|
Engagement Depth | • Pages per session | Heat map visualization |
Content Interaction | • Resource downloads | Progressive scoring meter |
Purchase Intent | • Demo requests | Priority-based alerts |
Account Fit | • Company size match | Compatibility score |
Real-Time Intent Monitoring
Integrate real-time buying signals into your dashboard. This approach can reduce cost per lead by 42% and increase lead volume by 71%.
Advanced Quality Tracking Features
When building the lead quality section of your dashboard, consider adding these features:
Intent Score Display: Highlight a dynamic score reflecting recent buying behaviors.
Engagement Timeline: Show how often and recently a lead has interacted.
Quality Threshold Alerts: Notify your team when a lead surpasses quality benchmarks.
These features make your dashboard more efficient and actionable.
Automated Updates for Lead Quality
Set your dashboard to update lead quality data every six hours. This ensures your sales team always works with the most current and relevant insights.
A great example of effective lead tracking comes from 24/7 Intent's dashboard setup for a law firm. As iLawyer's owner shared:
"Even though this was lead form ads, which are usually low quality, at least 80% of our ads were actually qualified".
3. Create Simple, Clean Layouts
A well-organized layout makes it easier to identify leads and take action effectively.
Strategic Element Placement
Place key lead generation metrics in areas that naturally draw the eye:
Dashboard Zone | Recommended Content | Purpose |
|---|---|---|
Top Left | Lead Quality Score | Aligns with Western reading patterns |
Top Right | Urgent Lead Updates | Highlights time-sensitive activities |
Center | Conversion Funnel | Shows the flow of lead progression visually |
Bottom | Detailed Analytics | Provides deeper insights and supporting data |
This arrangement creates a clear visual hierarchy, helping users focus on what matters most.
Visual Hierarchy Guidelines
To build a strong visual hierarchy, highlight critical metrics, leave enough white space for readability, and keep each section focused on essential information. Ensure this hierarchy works well on all devices, from desktops to smartphones.
Responsive Layout Design
Your layout should adapt seamlessly across devices. This approach helps reduce customer acquisition costs by 30-45% when combined with smart intent data usage.
"Intent data shows which people or businesses are actively researching a product or service like yours - so you can target high-intent buyers before they choose a competitor." - 24/7 Intent
Performance Optimization
Boost performance by focusing on these key areas:
Include only widgets that directly support lead qualification.
Use compressed images and optimized charts.
Implement progressive loading for detailed data sections.
Ensure core metrics load within 2 seconds.
These adjustments can help teams lower costs per lead by leveraging intent data more effectively.
4. Add Lead Filtering Options
Using lead filters effectively allows teams to zero in on the best opportunities and take action faster. When paired with clear goals and straightforward layouts, these filters can boost both lead qualification and conversion rates. Below are some key filter types that can make your dashboard more effective.
Key Filter Categories
Filter Type | Purpose | Key Metrics |
|---|---|---|
Intent Signals | Identify active buyer behavior | Product interest, search patterns |
Demographics | Focus on specific audiences | Industry, company size, location |
Behavior | Track engagement levels | Page visits, content downloads |
Lead Score | Rank prospects by priority | Quality rating, engagement level |
Timeline | Monitor lead activity over time | First contact, last interaction |
Smarter Filtering in Action
Adding smarter filters to your process can make a big difference. For example, a financial advisor integrated intent-based filters into their dashboard. The result? They cut their cost per lead by 42%, increased lead volume by 71%, and saw a 133% improvement in prospect show-up rates compared to Facebook's default targeting methods.
Real-Time Adjustments
Making real-time updates to filters based on intent data can sharpen your targeting and improve lead quality. This approach often results in higher conversion rates.
Advanced Techniques for Better Results
One automotive company used advanced filters - like credit score ranges, vehicle mileage, preferred car brands, and in-market affinity - to generate 1,608 qualified leads in just three days.
Keep Filters Updated
To keep your filters working effectively, refresh intent signals every six hours. Regular updates ensure your lead scoring and prioritization stay accurate, helping your team focus on the most relevant opportunities.
5. Use Colors to Show Priority
Using color coding can help teams quickly identify and act on high-priority leads.
Suggested Color Coding Framework
Priority Level | Color (Hex) | Use Case | Response Time |
|---|---|---|---|
Critical Leads | #D32D41 (Red) | Uncontacted >72 hrs | Within 2 hours |
High Intent | #DBAE58 (Gold) | Downloaded pricing | Within 24 hours |
Nurture Stage | #488A99 (Teal) | Blog subscribers | Within 48 hours |
Converted | #6AB187 (Green) | Closed deals | For tracking only |
The Role of Color Psychology
Research shows that consistent color coding improves task speed. For example, a UX study revealed a 23% faster response rate when color coding was used effectively. Limiting your palette to 3–5 colors prevents confusion and helps users focus on critical updates. Companies applying this technique have reported measurable results - enterprise dashboards saw a 14% increase in premium account conversions during Q2 2024, and 68% of marketers noted higher lead conversion rates when using color-coded indicators.
Accessibility Tips
To ensure everyone on your team can use these tools effectively, follow these accessibility guidelines:
Maintain a minimum 4.5:1 contrast ratio for text and background.
Pair colors with text labels for clarity.
Add patterns or shapes as backup cues for colorblind users.
Offer a high-contrast mode for enhanced visibility.
Real-Time Updates in Dashboards
Modern dashboards can adjust colors automatically based on lead behavior. For example, Microsoft Dynamics 365 reduced response times by 19% in Q3 2023 with its automated updates. Similarly, tools like 24/7 Intent reflect real-time changes, ensuring teams always have up-to-date information.
Tips for Effective Implementation
Maximize the impact of color coding with these practical steps:
Use neutral backgrounds (e.g., #F4F4F4) to highlight colors effectively.
Trigger color shifts based on user actions, like form submissions.
Reserve bright, alert colors for urgent situations only.
Ensure consistency by syncing color schemes across all tools and views.
Regularly review and update color rules, ideally every quarter.
When used thoughtfully, color coding can improve lead management, shorten response times, and enhance conversion rates.
6. Connect Lead Data to CRM
Syncing your dashboard's lead data with your CRM can significantly boost conversion rates - by as much as 2–3x - and cut acquisition costs by 30–45%.
Why Automated Data Flow Matters
Keeping your lead data updated in real-time is crucial for tracking and conversions. Companies that have adopted automated data flows often see notable improvements:
Metric | Before Integration | After Integration | Impact |
|---|---|---|---|
Cost per Lead | $10–$25 | $5–$12.50 | 50% reduction |
Lead Volume | Baseline | +71% increase | 1.7x growth |
Features of Real-Time Integration
Using real-time integration tools can help you make the most of these improvements. Key features include:
Auto-refresh every 6 hours to keep your data accurate.
Two-way syncing, ensuring updates are reflected in both systems.
Dynamic lead scoring based on behavior patterns.
Custom field mapping to align dashboard data with CRM fields.
Instant error alerts for any failed syncs.
A Real-World Example
One financial advisory firm implemented 24/7 Intent's integration system and saw impressive results. They cut their cost per lead by 42% and increased qualified leads by 71%. Their system now updates lead scores and priority levels automatically, using real-time intent signals. This case highlights the impact of a well-executed integration strategy.
Tips for a Smooth Integration
When connecting your lead dashboard to your CRM, focus on these areas:
Data Validation: Set up rules to ensure lead data is clean and accurate, avoiding duplicates and maintaining quality.
Field Mapping: Align dashboard metrics with CRM fields to ensure all important data is captured during synchronization.
Automation Rules: Use triggers based on lead behavior to adjust statuses or notify sales teams when engagement scores hit specific thresholds.
Performance Monitoring: Regularly check sync frequency and address any issues immediately to keep the system running smoothly.
7. Make Dashboards Work on Mobile
Optimizing dashboards for mobile devices is crucial for effective lead management. A mobile-friendly design ensures real-time insights are accessible and easy to use on the go.
Key Mobile Design Features
Creating effective mobile dashboards requires thoughtful design:
Element | Mobile Optimization | Impact |
|---|---|---|
Lead Lists | Vertical scroll with sticky headers | Speeds up response time by 37% |
Data Charts | Sparkline graphs for trends | Simplifies data interpretation |
Navigation | Bottom-mounted action bar | Improves usability |
Touch Targets | 48px minimum size with 8px spacing | Reduces input errors |
Enhancing Performance
A well-optimized mobile dashboard not only improves usability but also reduces data usage. For example, 24/7 Intent cut mobile data usage by 42% by focusing on selective real-time updates. To optimize performance, consider these steps:
Use lazy loading for non-critical content.
Cache static elements, such as logos and templates.
Limit real-time updates to high-priority lead alerts.
Implement WebSocket connections for instant notifications.
Designing for Touch
Position key actions within the bottom third of the screen for easier access on mobile devices. This layout ensures smoother touch interactions and quicker task completion.
Clear Data Visualization
Good data visualization makes it easier to interpret information quickly. Use design elements that are both functional and visually appealing:
Color-coded progress rings to show lead conversion stages.
Swipeable card layouts for comparing lead sources intuitively.
Vertical bar charts with tap-to-expand details for a mix of clarity and usability.
Testing for Mobile Success
Regular testing ensures your mobile dashboard meets user needs. Focus on these performance indicators:
Test Area | Key Metric | Target Goal |
|---|---|---|
Load Time | Initial render | Under 3 seconds |
Interaction | Time to first action | Under 5 seconds |
Navigation | Steps to reach lead data | Maximum 2 taps |
Updates | Sync delay | Under 30 seconds |
Research shows that poor mobile performance can lead to quick abandonment.
Offline Functionality
Your mobile dashboard should work seamlessly even without a stable internet connection. An offline-first approach allows users to update leads and statuses in real-time. Once connectivity is restored, the system can automatically sync the data. This ensures continuous tracking and supports an always-on dashboard strategy.
8. Show Live Conversion Updates
Real-time conversion tracking transforms static dashboards into dynamic tools for monitoring leads. With instant updates on lead actions, teams can act quickly and seize opportunities as they arise.
Live updates directly impact performance. Quick responses to lead activity not only speed up conversions but also minimize delays that could cost you potential customers.
To maintain a balance between timely updates and system efficiency, 24/7 Intent refreshes its data every 6 hours.
Here’s how this approach has improved results:
42% drop in cost per lead
71% jump in total leads generated
"We eliminate wasted ad spend by targeting buyers actively searching for what you offer - boosting conversions 2–3x and cutting customer costs by 30–45%." - 24/7 Intent
Up next: Fine-tune how you track lead sources to gain even deeper insights.
9. Track Lead Sources Clearly
After refining your dashboard with effective filtering and prioritization, the next step is to ensure clear tracking of lead sources. This allows you to fine-tune spending and improve conversion rates.
Set up dedicated fields for lead sources with standardized, precise labels. For example, use labels like 'Facebook Lead Ad - Q2 Campaign' instead of vague terms. This detailed tracking makes it easier to pinpoint the campaigns driving the best results.
Lead Source | Volume | Conversion Rate | Avg. Deal Size |
|---|---|---|---|
Organic Search | 38.6% | 33.9% | $12,400 |
Paid Ads | 22.3% | 19.0% | $9,800 |
Referral | 7.9% | 9.1% | $14,200 |
Direct | 26.1% | 33.9% | $11,500 |
Combine this data with lead quality metrics to get a full picture of performance.
Here are some tools and techniques to enhance your tracking:
UTM Parameter Integration: Using UTM parameters can improve lead source attribution accuracy by 27% compared to manual methods.
Automated Source Assignment: Automating the population of source fields reduces manual errors and ensures consistency.
Multi-Channel Tracking: Don’t forget to track offline sources too - 35% of high-quality B2B leads come from offline channels.
"LeadSquared implemented tracking URLs for their social campaigns, which led to a 40% increase in identifying high-conversion sources within just 60 days. Their data revealed that LinkedIn generated 22% more qualified leads than Twitter, prompting a 15% reallocation of their budget." - LeadSquared
To maintain data accuracy, regularly clean up duplicate entries (e.g., 'FB' vs. 'Facebook') and validate UTM parameters on a monthly basis. This ensures your data remains 95% accurate or better.
Finally, use visualization tools to display both real-time lead volume and long-term conversion rates by source. This approach ties everything together, enhancing your dashboard's ability to optimize lead generation strategies.
10. Add Detailed Lead Path Views
Improve your lead tracking by creating detailed visualizations of how leads move through your sales funnel. These views can help identify conversion trends and pinpoint where leads drop off.
Interactive path views allow you to map out key touchpoints in order. According to research, companies that leverage intent data often see 2–3× higher conversion rates by identifying the best engagement opportunities.
Here’s a useful way to organize your lead path dashboard:
Journey Stage | Key Metrics to Display | Update Frequency |
|---|---|---|
Initial Contact | Source, Intent Score, Time | Every 6 hours |
Engagement | Content Viewed, Time Spent | Every 6 hours |
Qualification | Lead Score, Demographics | Every 6 hours |
Conversion | Deal Size, Close Time | Every 6 hours |
This setup helps you integrate intent signals, making your path analysis even more precise.
Using intent data can also help predict lead behavior with greater accuracy. Businesses that adopt intent-based analysis have reported cutting customer acquisition costs by 30–45%.
Core Features for Path Views:
A timeline that highlights all touchpoints
Tracking intent scores at each stage
Indicators for conversion probabilities
Identification of drop-off points
Metrics for time-to-conversion
These features provide a solid starting point for refining each stage of the lead journey.
Advanced Tips for Path Analysis:
Measure how quickly leads move between stages
Track how deeply leads engage across various channels
Analyze time spent on critical decision points
Compare the paths of leads that converted versus those that didn’t
Conclusion
A well-designed dashboard doesn’t just look good - it works smarter. It accelerates lead tracking, improves conversions, and significantly lowers acquisition costs. When these principles are applied, businesses can develop a streamlined and effective dashboard strategy that delivers measurable results.
One standout factor driving dashboard success is real-time data integration. When paired with intent-driven solutions, this approach consistently leads to higher conversion rates and reduced costs.
Here’s a snapshot of the impact of combining clean design with intent-focused data:
Metric | Average Improvement | Timeframe |
|---|---|---|
Conversion Rate | 2–3× higher | Within first month |
Customer Acquisition Cost | 30–45% lower | Within first month |
Lead Quality | 71% increase | First 30 days |
Show-up Rate | 133% increase | First 30 days |
These numbers tell a clear story: businesses that integrate real-time data and intent-driven design into their dashboards see substantial gains. For example, companies using this approach can:
Track over 100 billion daily buying signals.
Monitor updates across 270 million consumer profiles.
Spot high-intent buyers faster than competitors.
Adjust ad spending based on actual buyer behavior.
Real-world examples back this up, showing conversion rates doubling or tripling and acquisition costs dropping by as much as 45%. These achievements are driven by sharper lead tracking, quicker responses, and more accurate targeting.
Ultimately, smart dashboard design combined with real-time intent data transforms lead generation. Businesses adopting this strategy consistently enjoy higher-quality leads, better conversion rates, and lower costs - proving that data-driven dashboards are a game changer.
FAQs
How does using real-time data in my dashboard boost lead generation?
Integrating real-time data into your dashboard can transform your lead generation efforts. It helps you hit the sweet spot - reaching high-intent customers exactly when they’re ready to engage. With current insights at your fingertips, you can fine-tune your ad spend, sharpen your messaging, and concentrate your efforts on prospects primed to convert.
Reacting instantly to shifts in customer behavior not only keeps you ahead of the competition but also boosts the effectiveness of your marketing. The result? Greater efficiency and a stronger return on investment (ROI).
What essential metrics should a lead generation dashboard include for maximum effectiveness?
An effective lead generation dashboard zeroes in on metrics that matter, offering a clear view of your campaign’s performance while guiding your next steps. Here are the key metrics you’ll want to track:
Leads Generated: Keep tabs on the total number of leads captured over a specific period. It’s the foundation of understanding how your efforts are paying off.
Conversion Rate: This tells you what percentage of those leads are actually turning into paying customers - a direct reflection of your campaign’s effectiveness.
Cost Per Lead (CPL): Know exactly what you’re spending to acquire each lead. This helps you balance your budget and ensure you're getting the most bang for your buck.
Lead Source Performance: Break down which channels - whether it’s social media, email campaigns, or paid ads - are bringing in the highest-quality leads.
By focusing on these metrics, your dashboard becomes more than just a collection of numbers. It transforms into a tool for refining your strategies and increasing your return on investment.
Why is mobile optimization important for dashboards, and how does it enhance lead management?
Mobile optimization plays a crucial role in making dashboards accessible and practical for smartphones and tablets - devices that are now a staple for teams and decision-makers. A dashboard designed with mobile users in mind enables them to keep an eye on key metrics, manage leads, and respond quickly, no matter where they are.
When businesses tailor their dashboards for mobile use, they can boost responsiveness, provide a smoother user experience, and minimize delays in following up on leads. This not only supports quicker decision-making but can also help drive better conversion rates.